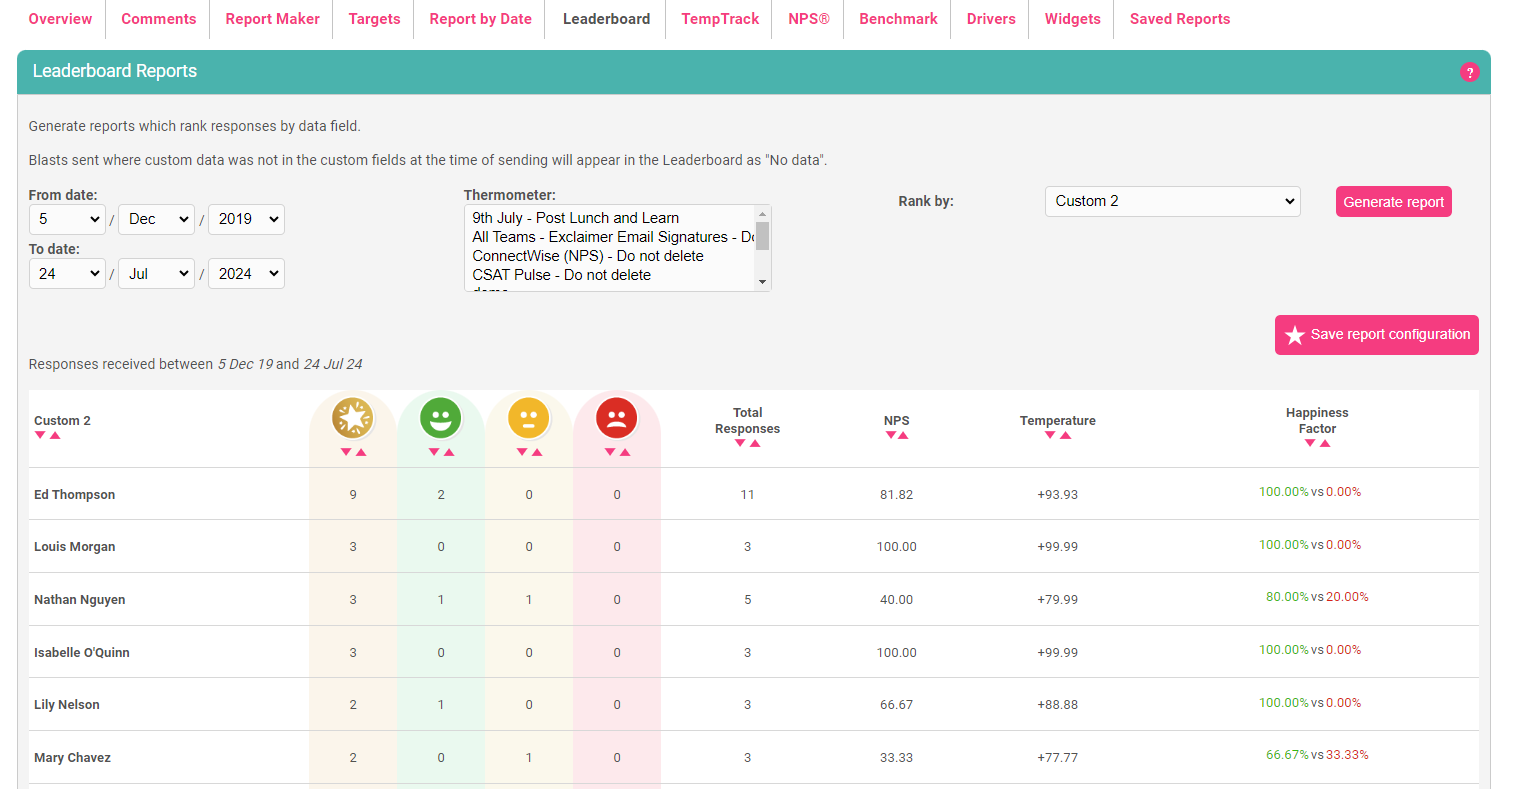
Our leaderboard reporting allows you to generate a report which ranks data associated with your Thermometers using your custom field data:
Creating a League Table report
To generate a report, go to Reporting > Leaderboard
Firstly, choose a date range and select the custom field you’d like to rank your data by.
Select a Thermometer. (Note you can select multiple Thermometers by CTRL-clicking.)
Click “Generate Report”.
Example report
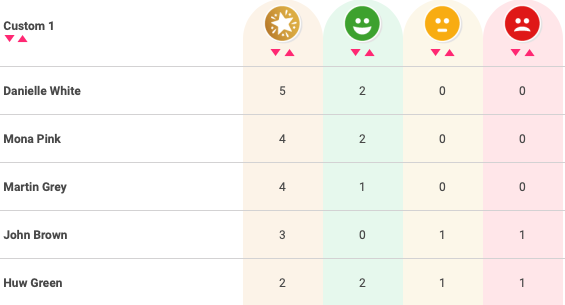
Let’s say your Account Manager names are stored in the ‘Custom 1’ field alongside each response.
You will be able to generate a leaderboard showing the response data for each Account Manager, by reporting on Custom 1:
To order the table by other data labels– e.g. number of Gold stars / Temperature rating, etc, simply click on the ascending / descending pink arrows.
You can also create leaderboards around customer data. Select email / first name / surname / company from the Custom field drop-down list to create your report.
Saving configuration
Once the report is generated, you can save the it for future use, using the 'Saved report configuration'. This will allow you to save the Leaderboard as a single point in time; or a rolling or current time period.
