Report by date allows users to see all data attached to a Thermometer(s) across any timeframe. Response data is collated within the timeframe set and displays both numerically and visually.
If using this report to look at Email thermometers, (sent on a blast basis repeatedly over time), you can see the temp rating trend graph overtime at the end of the report.
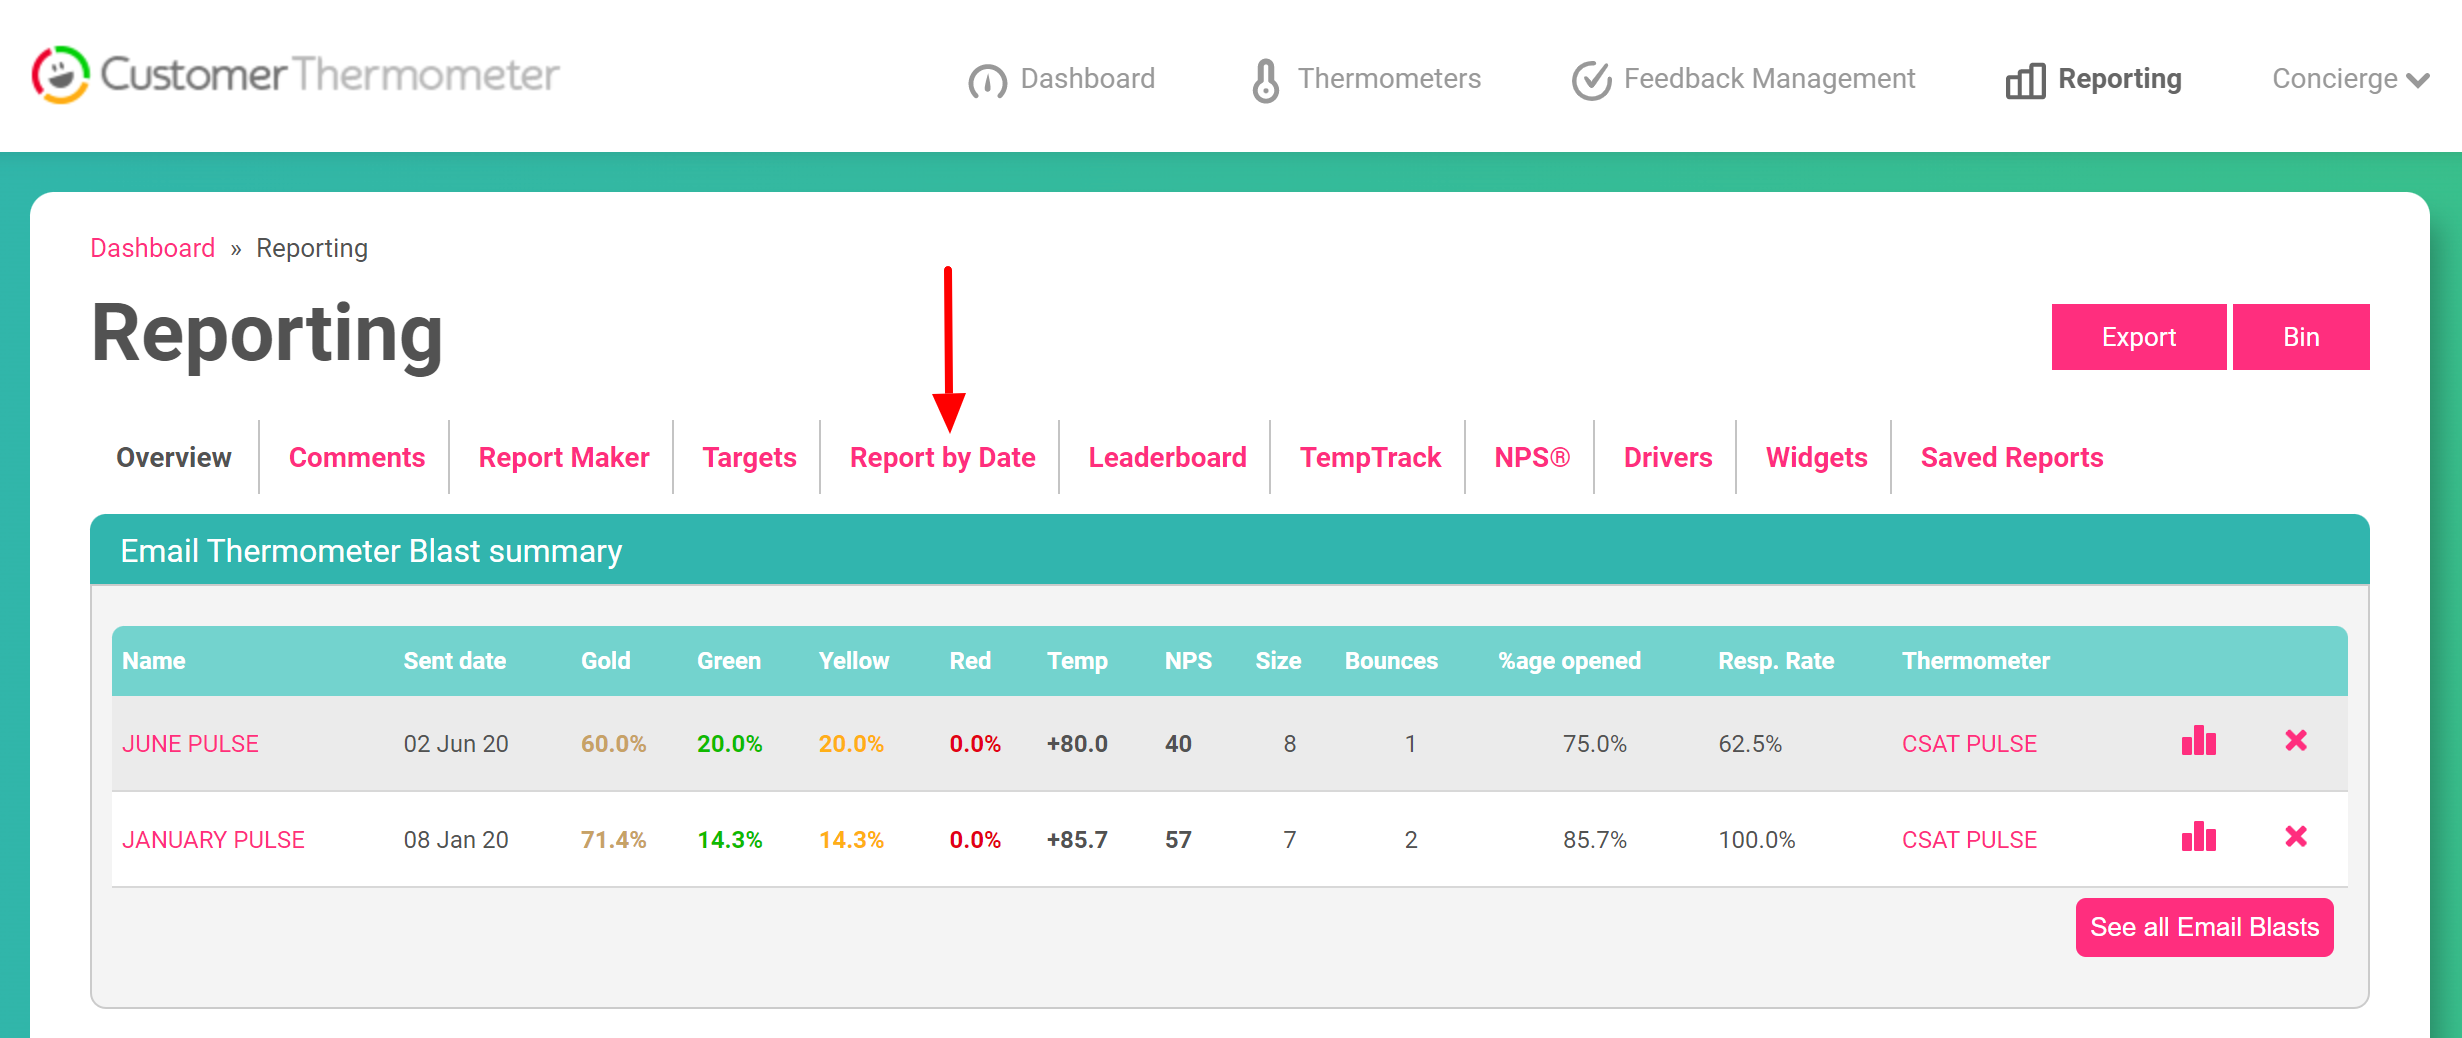
Access Report by Date as shown below in the Reporting area:
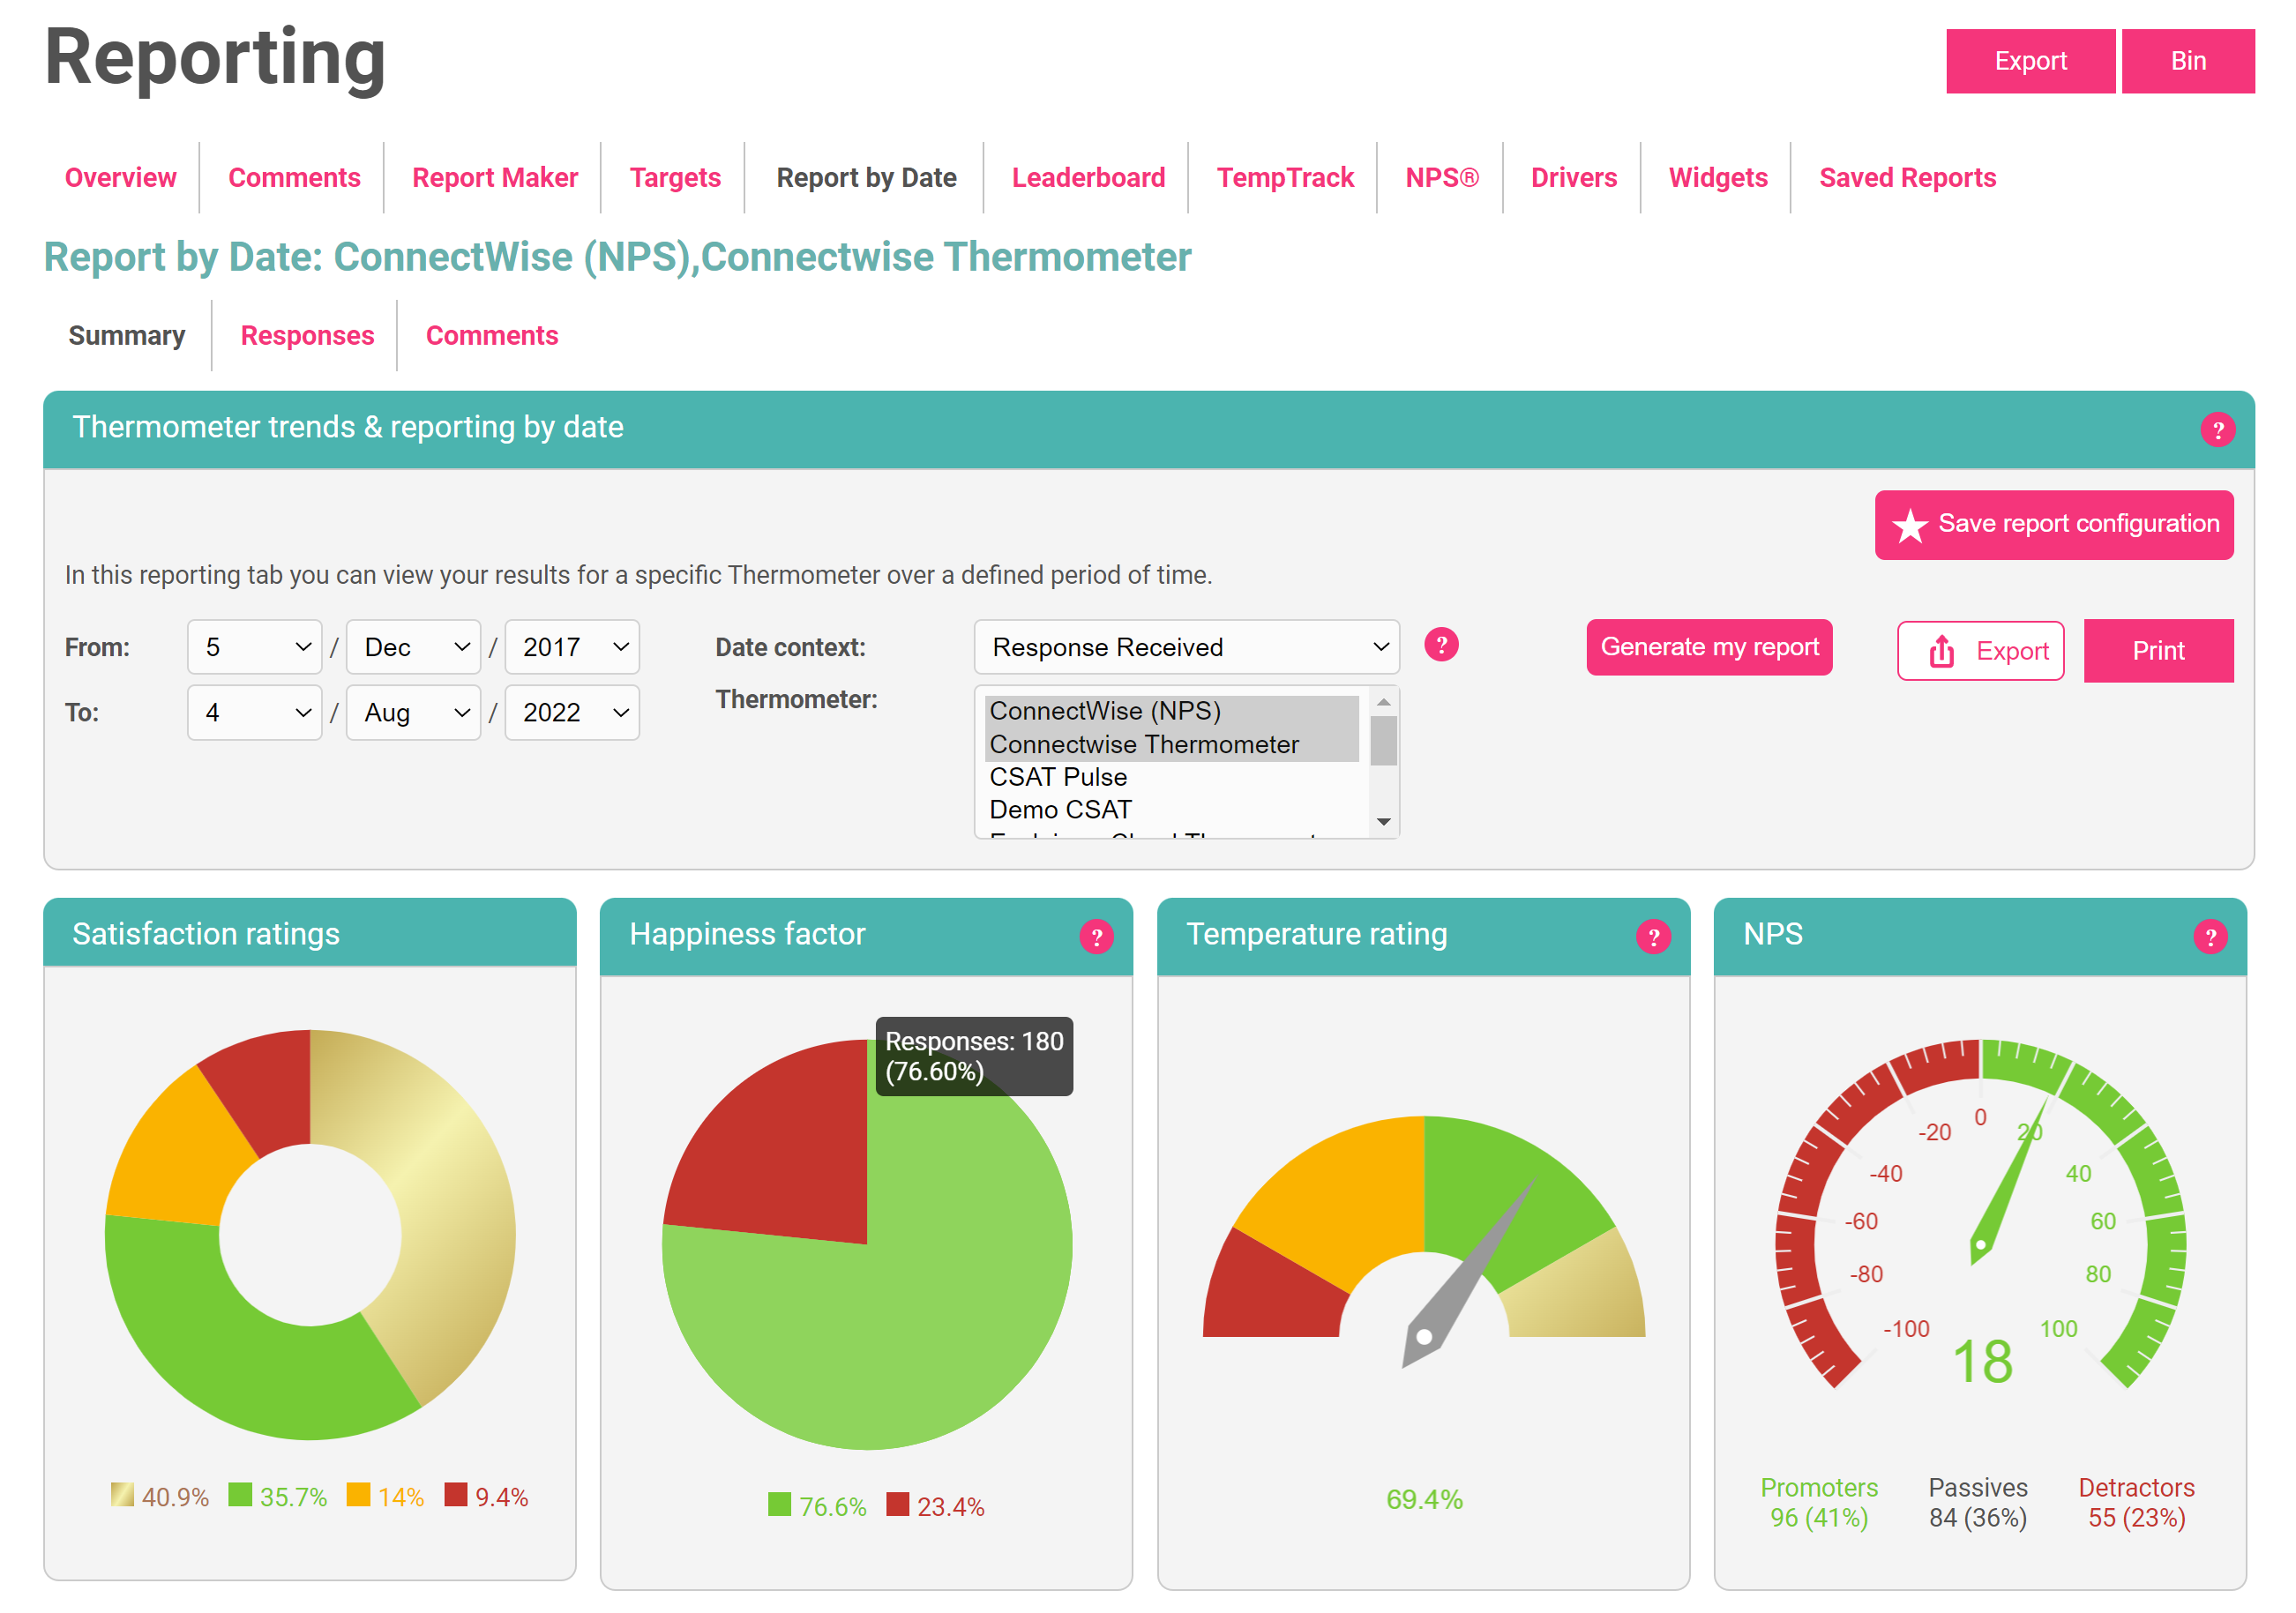
Select your Thermometer(s) and date range, and click “Generate my report“.
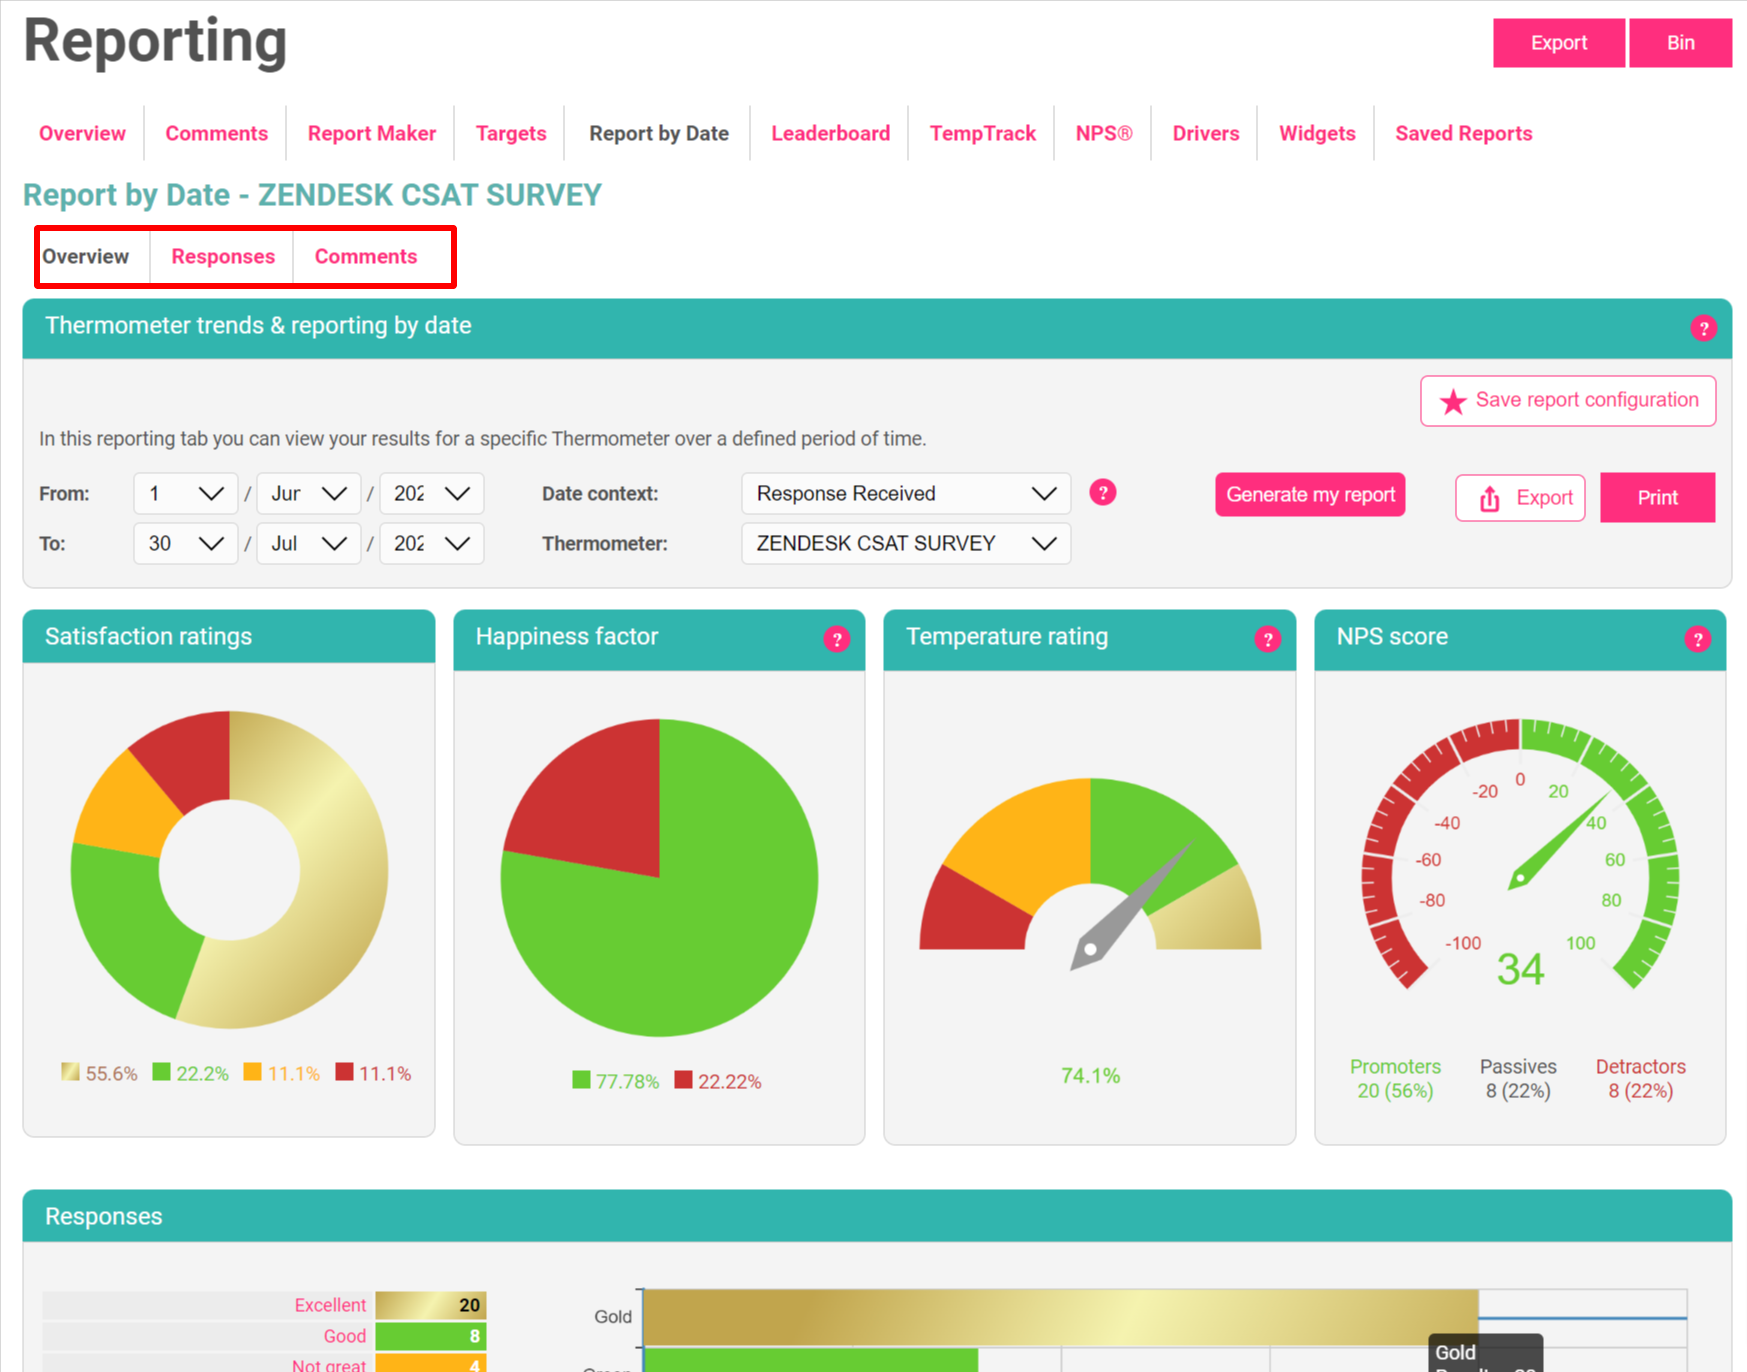
The Responses tab shows response detail for that Blast, with up to 3 custom fields showing per response, alongside any comments, plus IP address detail.
The comment tab will just display the comments within this timeframe.
Additional custom field data can be seen by exporting your data by clicking the white 'Export' button.
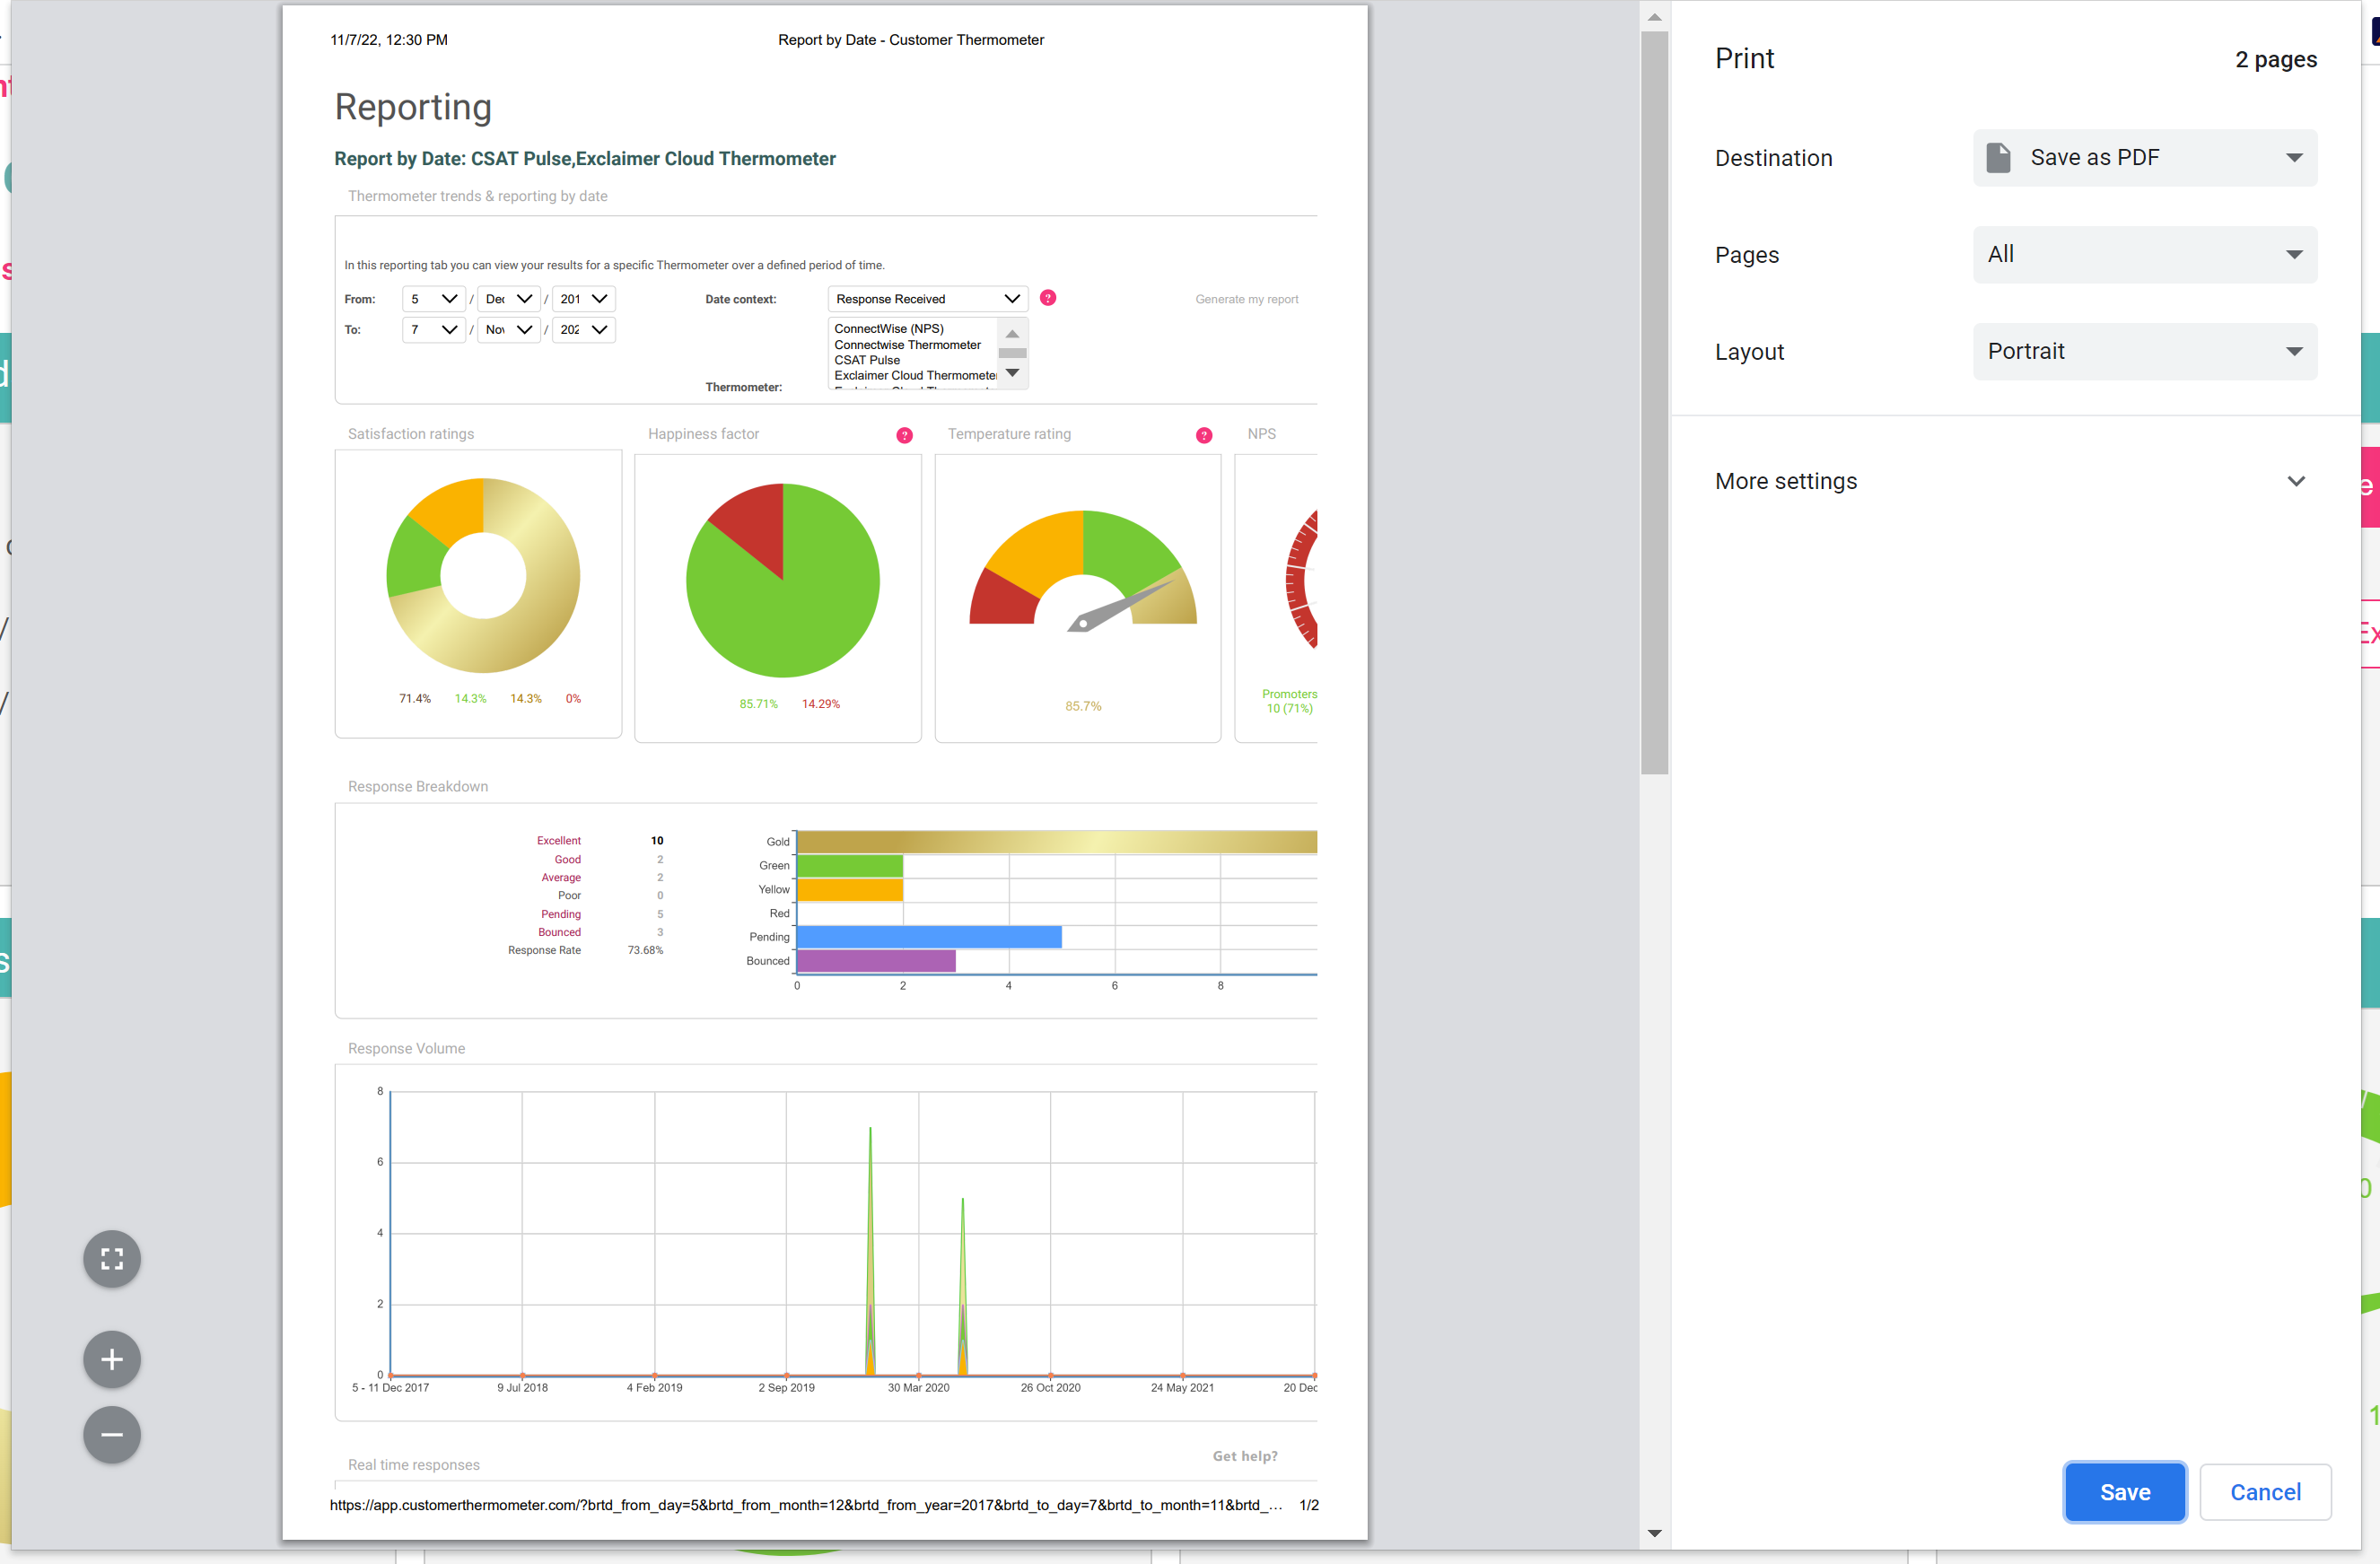
If you would like to save the Overview tab as a PDF please click 'Print' and the option will be available to you.