Please note the ribbon report is not included within the Runner plan.
Overview
The reporting Ribbon allows you to harness all sorts of different, personalised reports from your Reporting suite and pin them to your main dashboard. You can create up to 40 reports such as mini leaderboards and specific thermometer reports on CSAT and NPS.
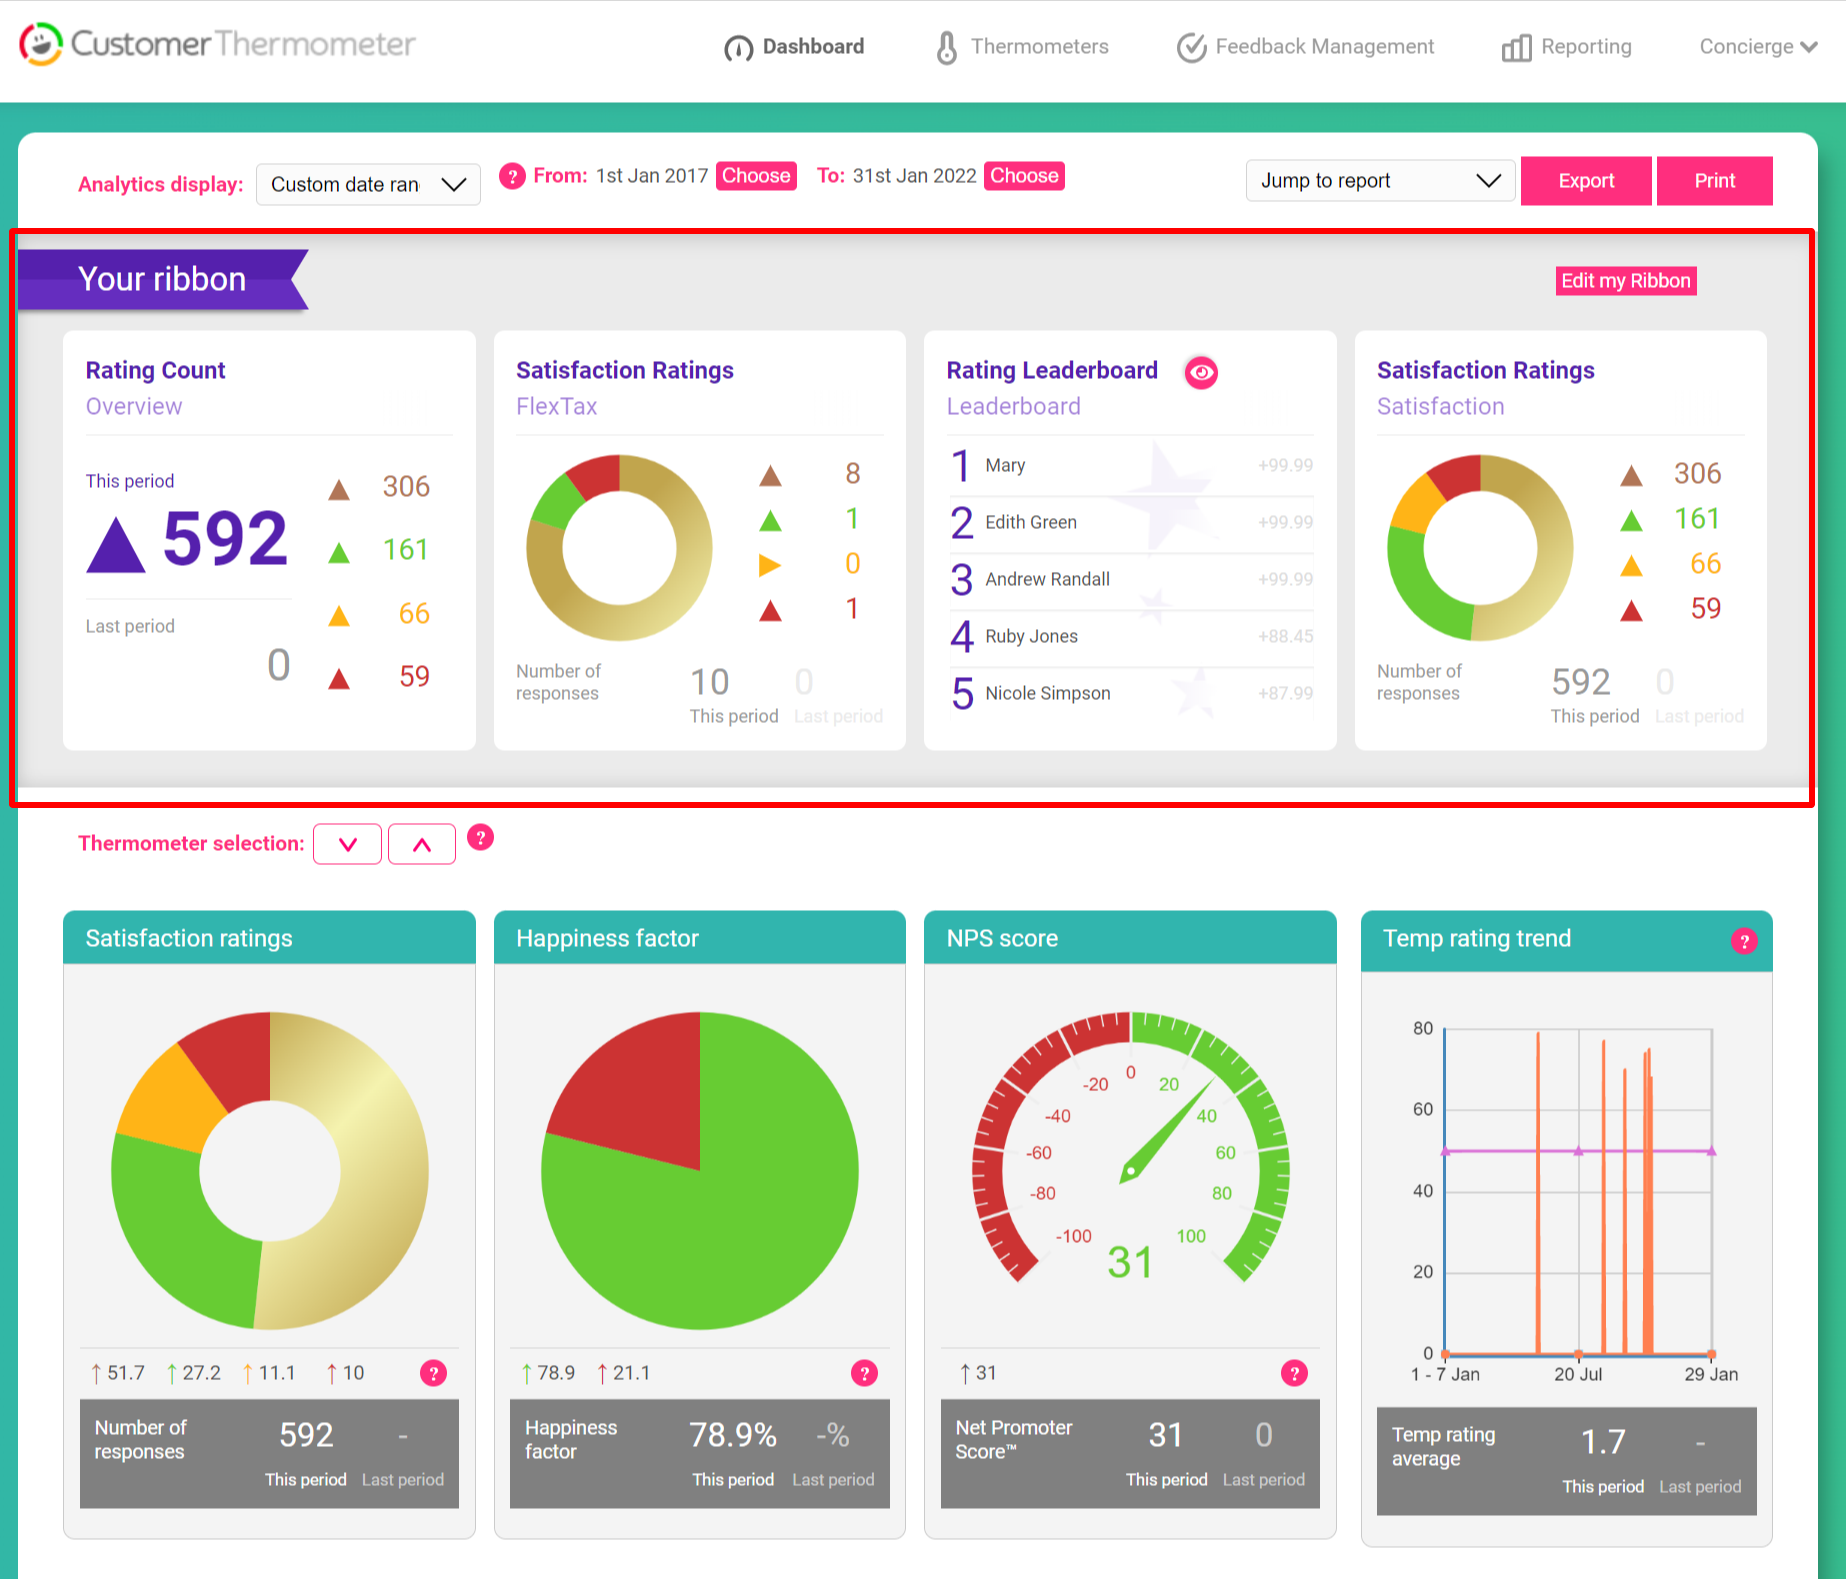
You can find the Ribbon at the top of your main dashboard marked with the purple banner.
The Ribbon will appear as shown below before you first start building your reports.
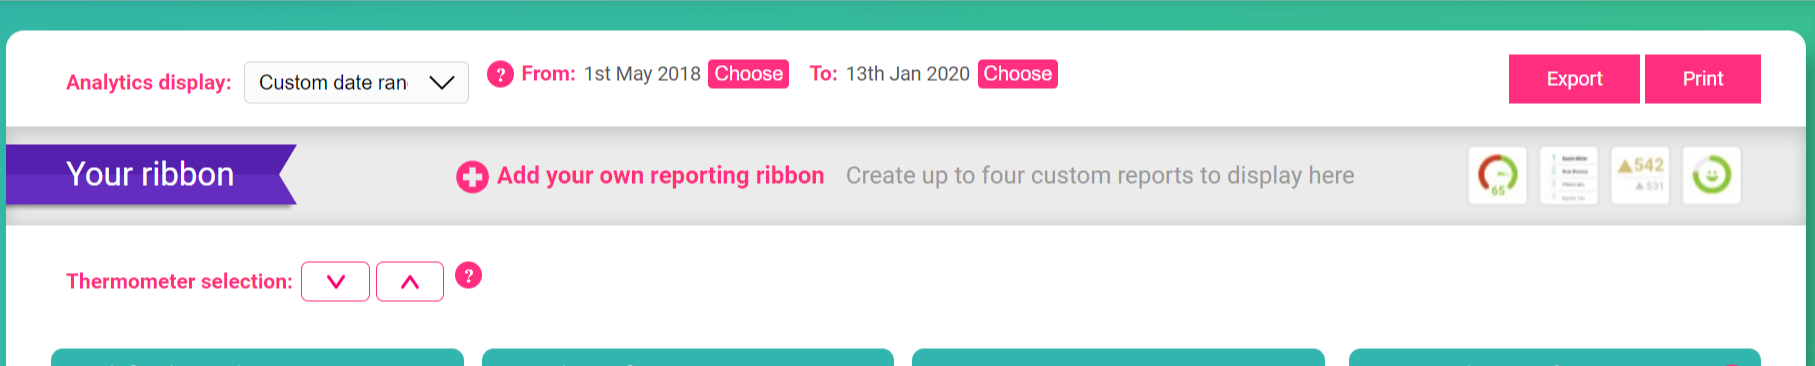
To add a new report click the pink ‘Add your own reporting ribbon’ button then the below pop-up will appear where you can select what type of report you’d like to build.
We have a few report options for you to choose from including satisfaction ratings, temperature ratings, NPS, rating count, CSAT, happiness factor, and league table.
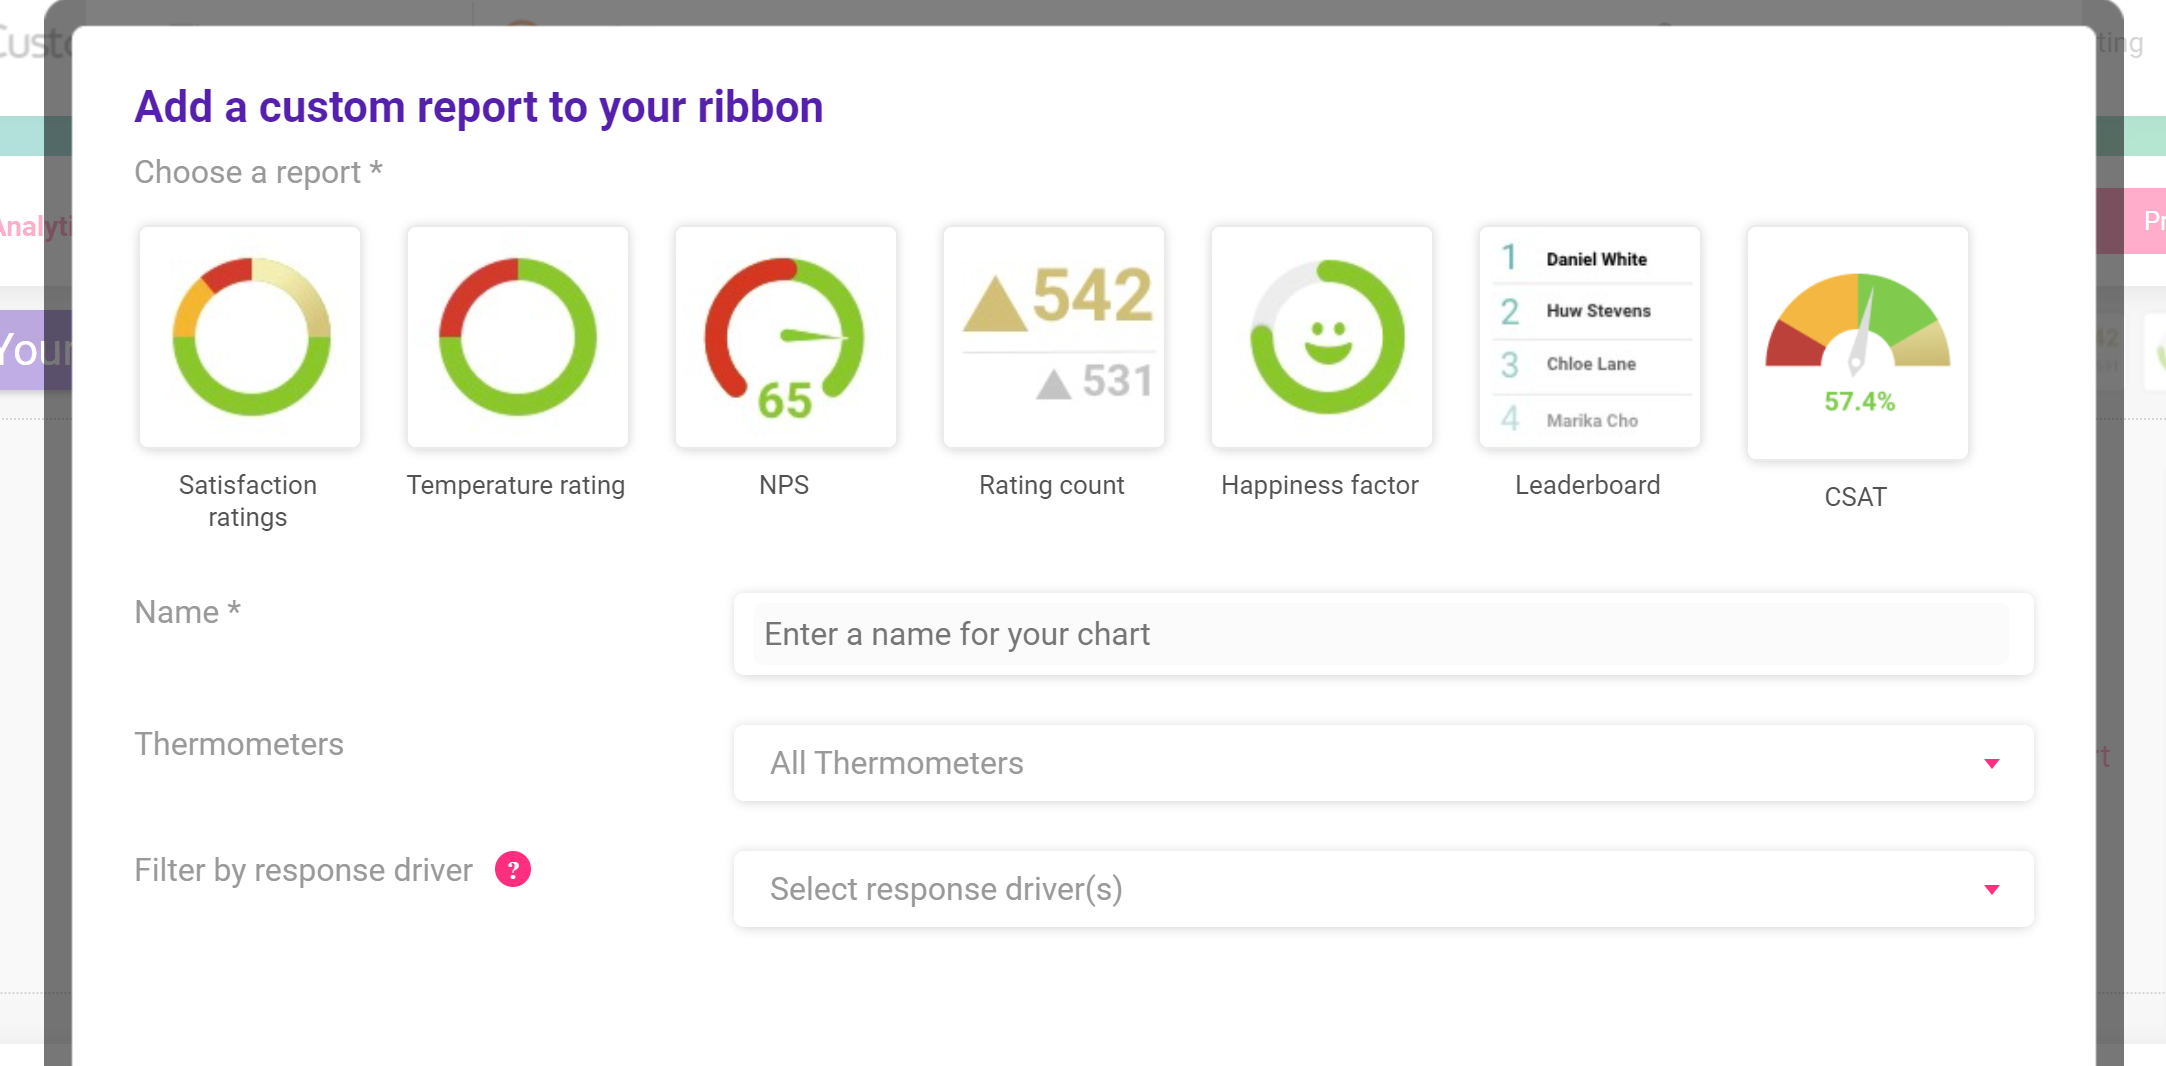
From here you can select the report you’d like to create.
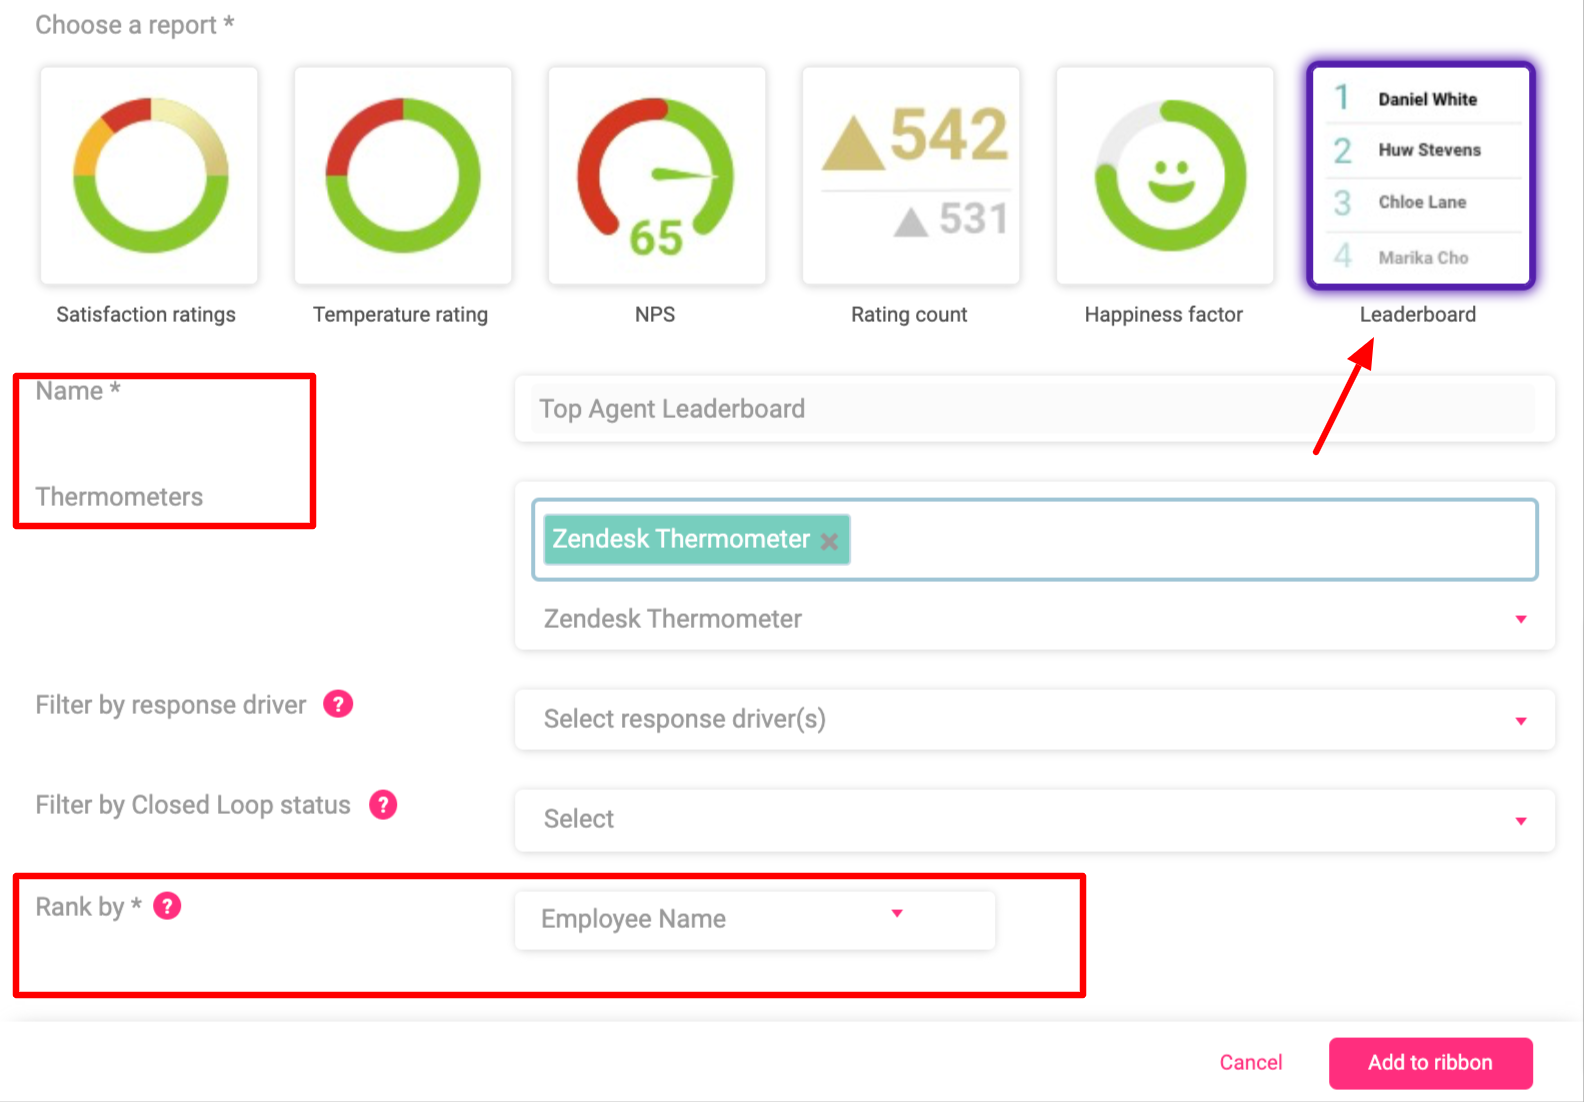
Please note our League Table Ribbon Report ranks by Temperature Rating, and not by the number of responses.
In the example below, we’ll show you how to create a happiness factor report by first selecting and then naming your report.
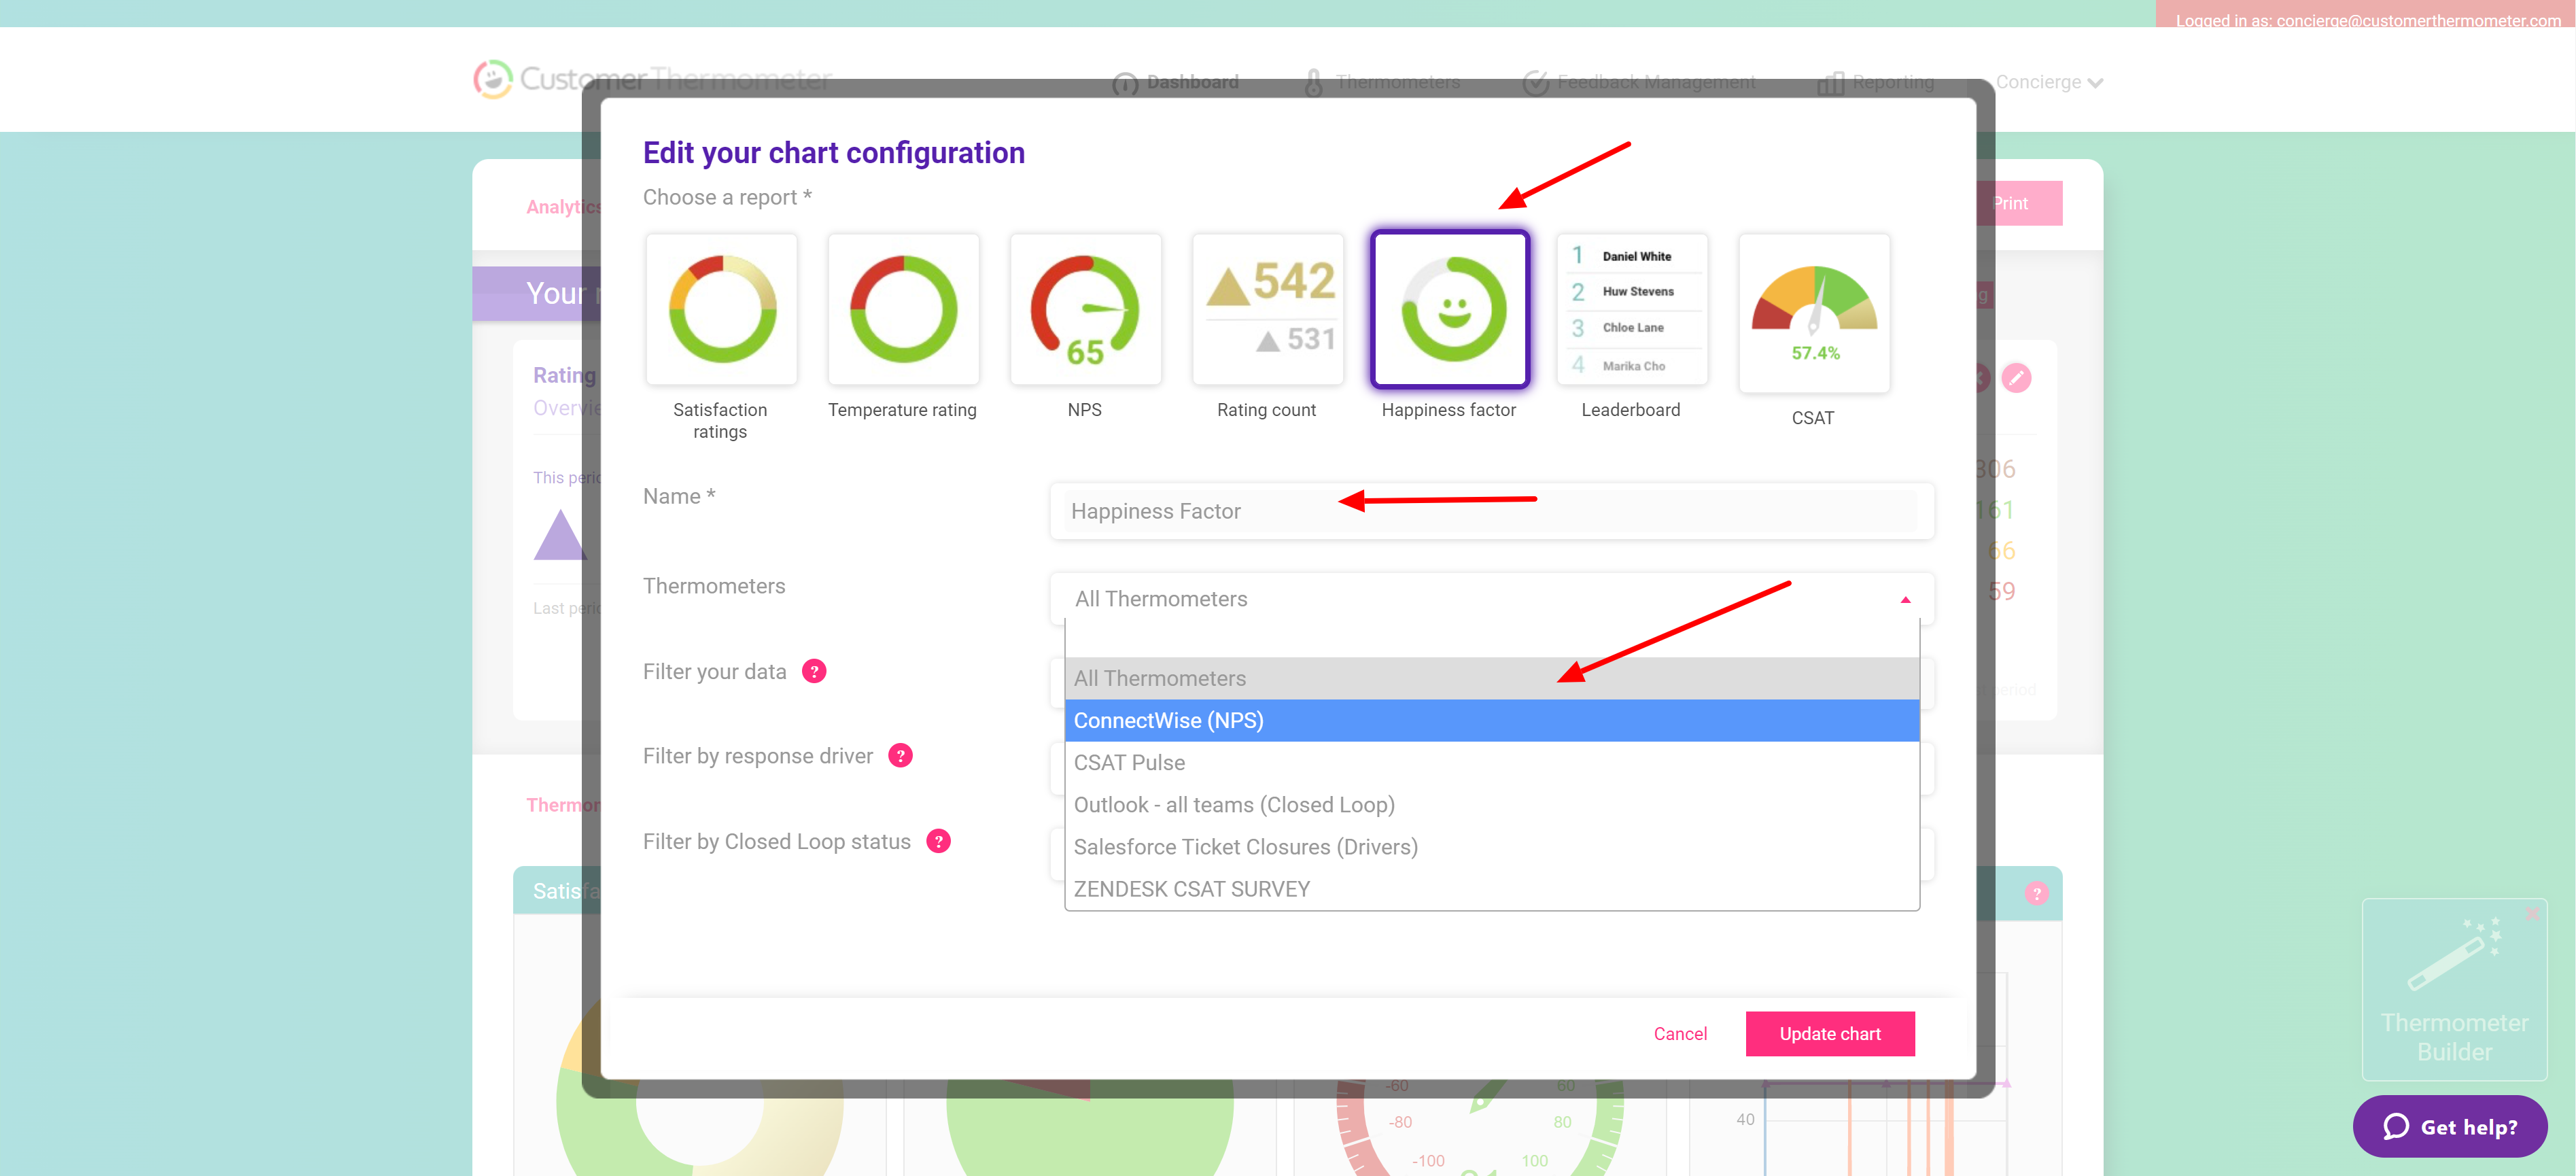
You can then either select ‘All Thermometers’, one Thermometer or multiple specific Thermometers to be included within this report by using the drop-down as shown above.
Once your Thermometer has been selected you now have a few options, you can either filter on the data you would like to show by selecting a custom field from the dropdown (1.) and if you’d like to drill down further you can filter by a specific value within that custom field (2.). Or if you’d like to skip that part you can just go straight to step 3. ‘Add to ribbon’.
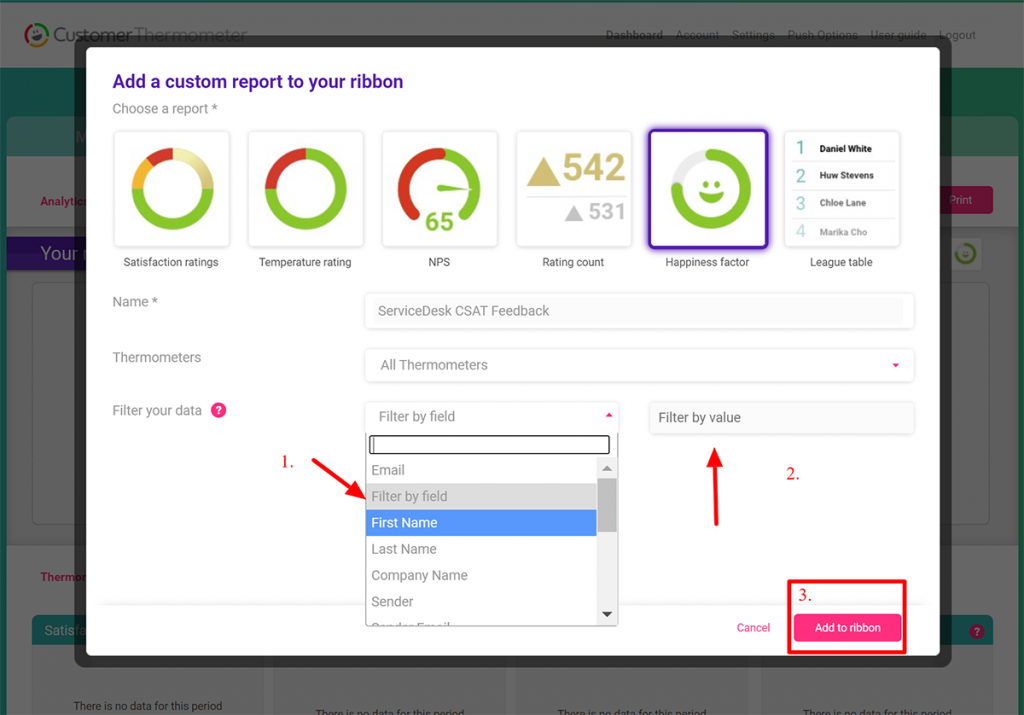
Once you’ve clicked the ‘Add to ribbon’ button the report will now show in your Ribbon panel on your main Mission Control dashboard.
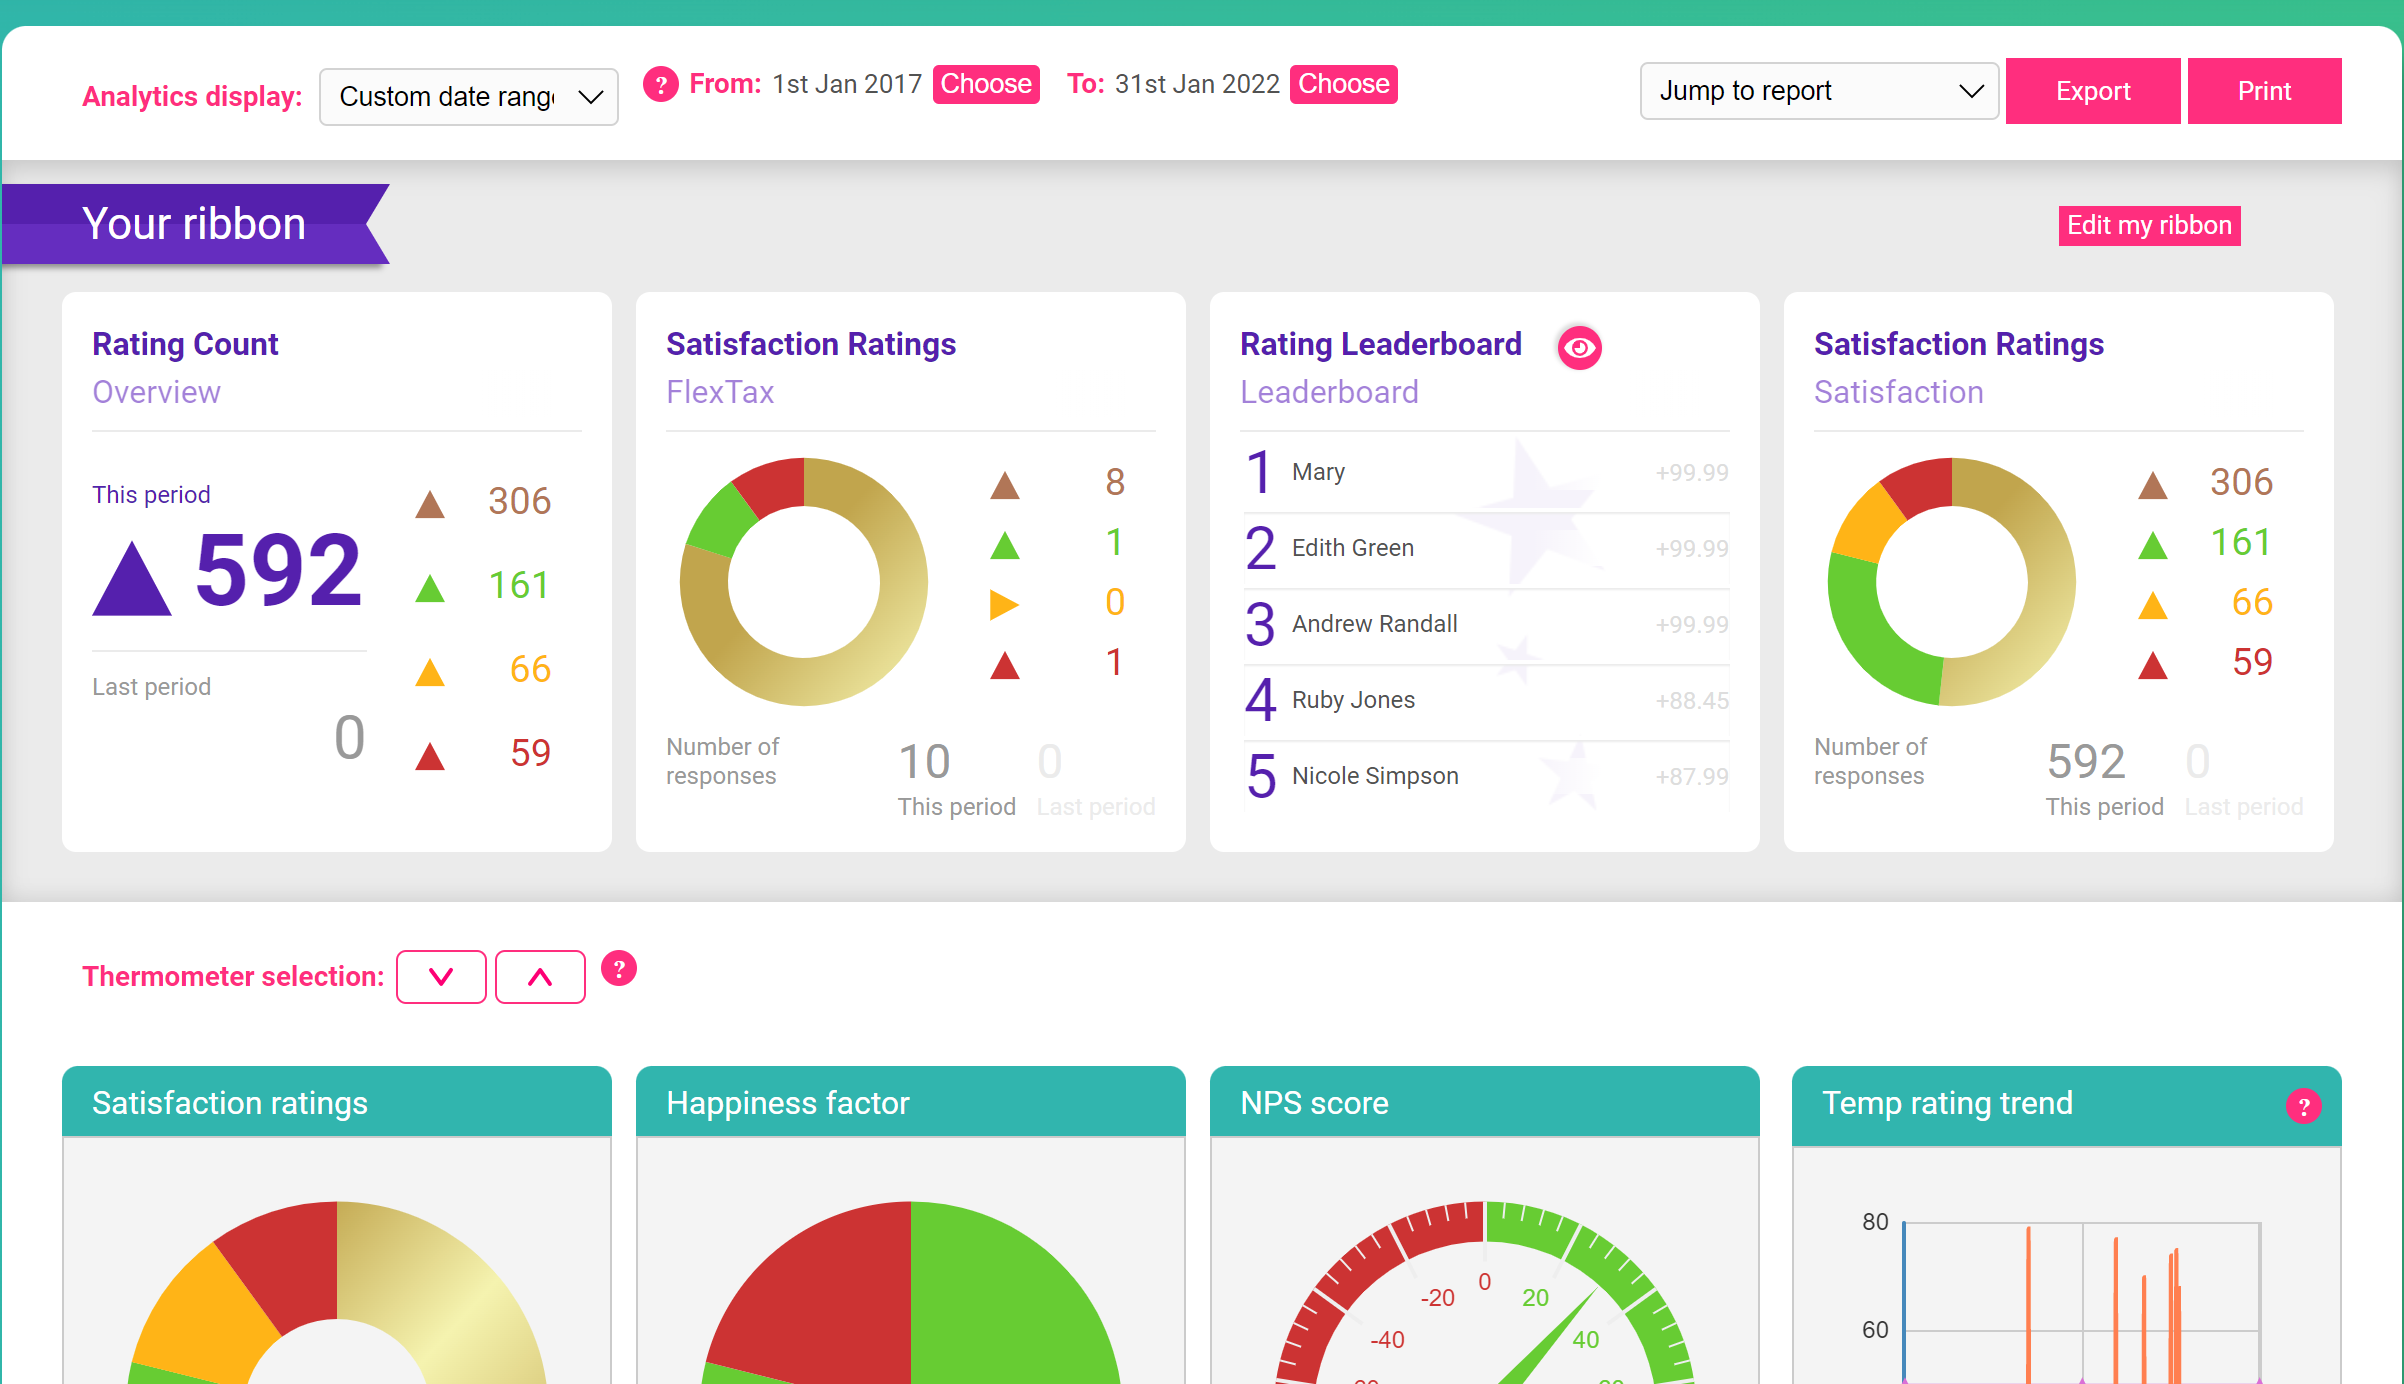
If you need to edit this report, remove or add additional reports you can click the ‘Edit my ribbon’ button which will give you your edit options. You can then click ‘Finish editing’ once you are happy.
These reports will stay pinned to your main Dashboard and will show real-time stats.
Below is an example showing how to create a league table for your top 5 agents – don’t forget to select your custom field which holds your agent’s names in the 'Rank by' section: