Targets
What’s it for?
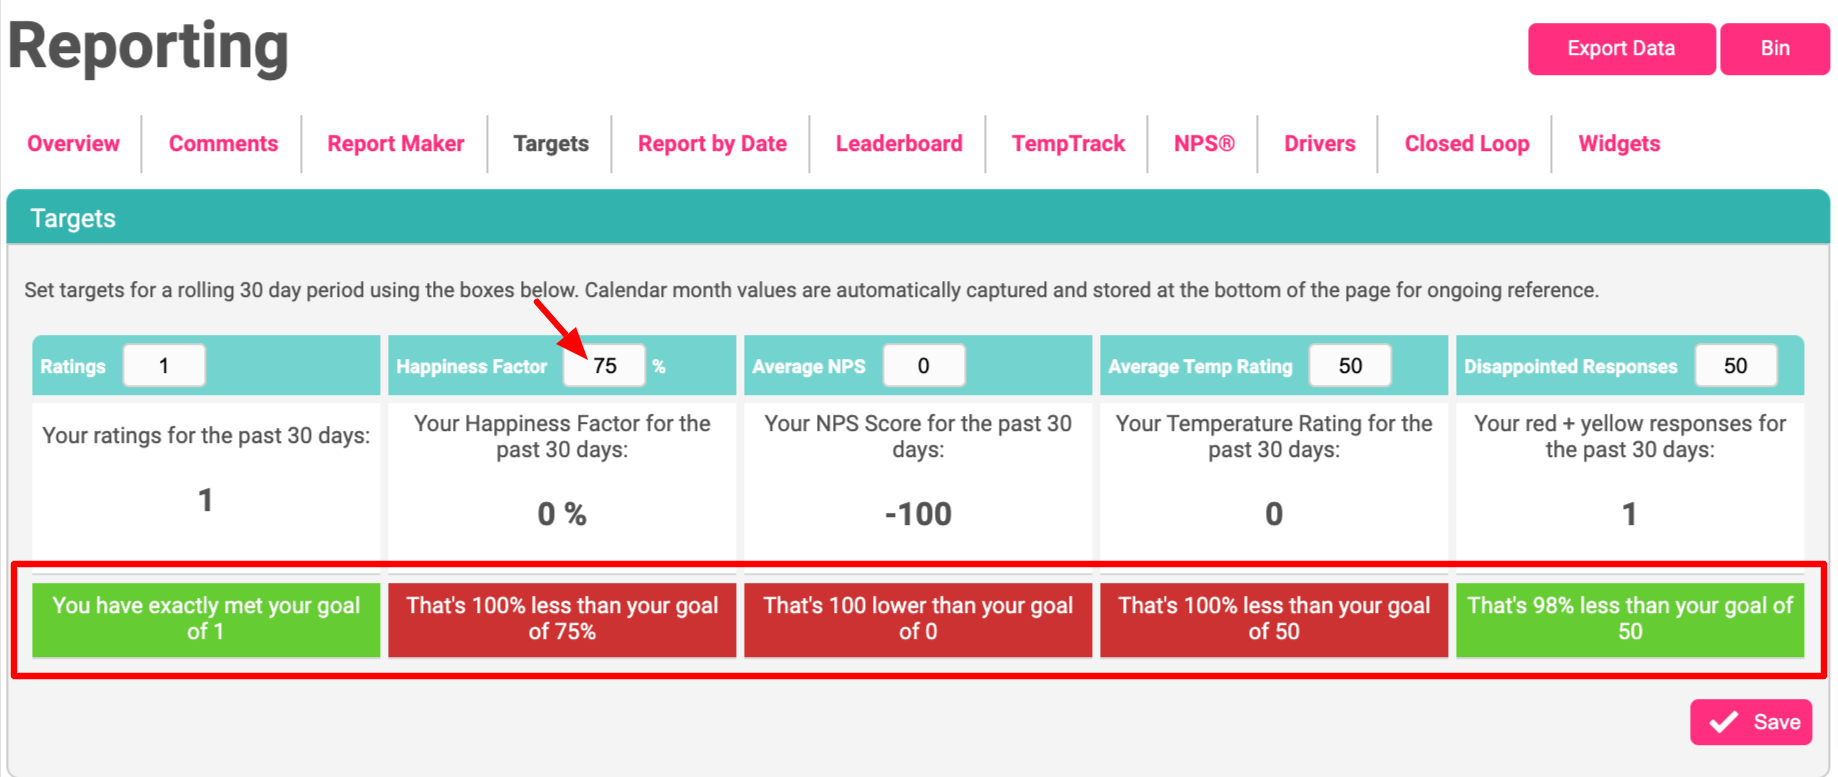
Setting targets against 5 commonly-requested KPIs which are the number of ratings, Happiness Factor, Average NPS, Average Temperature Rating, and disappointed/ negative responses.
The blocks turn red or green depending on whether you are meeting/ exceeding target or not.
Usage
Enter your agreed targets into the white Target boxes.

Your Target reporting will then display where you are against each target.
Green indicates things are good. Red indicates you’re below target.
At the end of each month, the historical data section rolls up the results and saves them on a per-month basis.

If you’ve been using Customer Thermometer for several months without using Targets and decide to enter targets, we will calculate historical data as a one-time set-up and display it in the table below.
What’s the difference between the metrics?
Temperature rating provides a single number per Blast to benchmark trends.
Happiness factor is the %age happy vs %age disappointed responses.
NPS score, when enabled, provides your Net Promoter Scores.