Temperature rating
Temperature Rating – Blast Breakdown screen
Track progress with a single metric for each Blast.
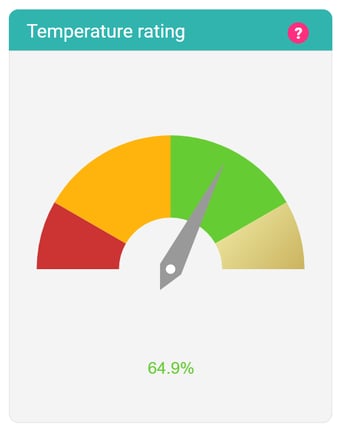
Customer Thermometer calculates (and updates in real time) a “Temperature rating” for each Blast.
So for each Email Thermometer or Embedded Thermometer Blast, no matter how large or small, the system provides a Temperature rating to compare every Blast using the same metric:

Customer Thermometer assigns values:
0 to a red response,
33.333 to a yellow response,
66.666 to a green response
99.999 to a gold star response
We then divide this total by the number of responses received.
By tracking trends in Temperature rating over time, you can see whether your satisfaction levels across the board are improving, declining or staying the same, and take action.
Temperature rating – main dashboard
The same scoring principles apply to the main dashboard dial.
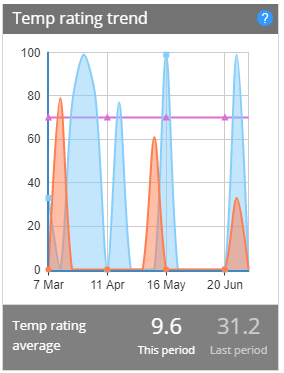
Average scores for each week are displayed over time, showing trends:

The orange graph is the Temperature Rating across your account for each week.
The blue line is the Temperature Rating for the previous corresponding period.
The pink line is your Target, as set in the Targets area.